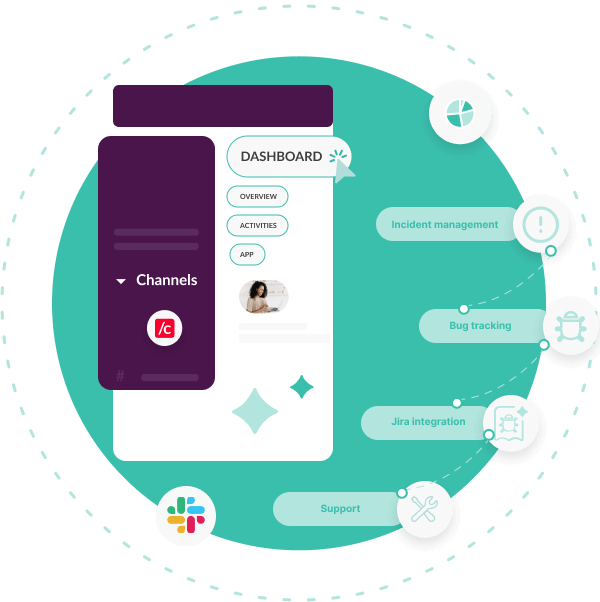
Insights from the Dashboard
The Insights section is found in the Dashboard, our web-based UI. The data-rich visualizations give you the most important metrics for your incident management, bug tracking, Jira and support tickets.
Provide information to key stakeholders and identify bottlenecks or areas where you can boost efficiency.
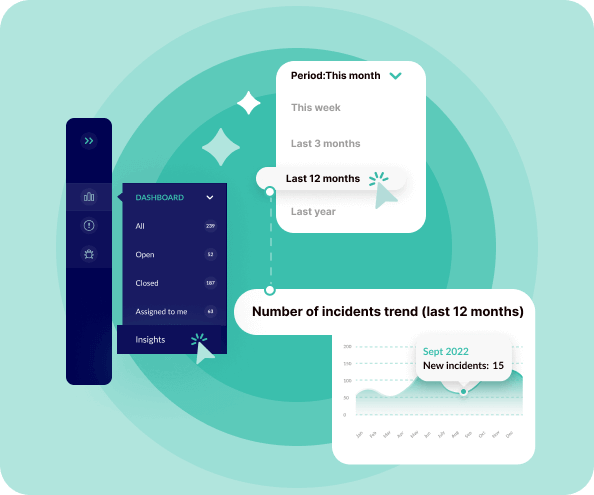
Identify important trends over time
Stability and site reliability for engineers
Optimize your processes and build best practices

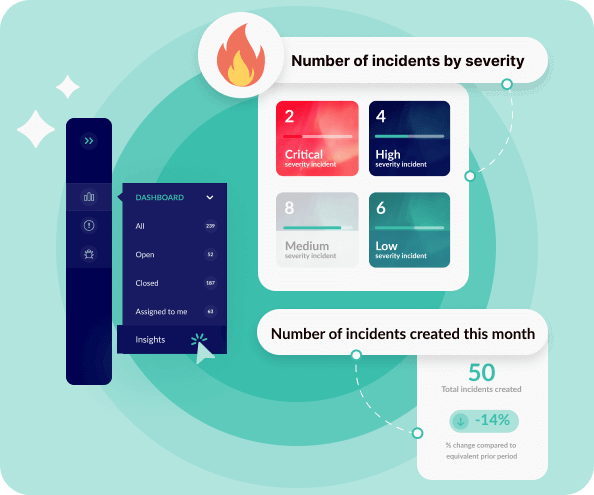
Number of incidents by severity
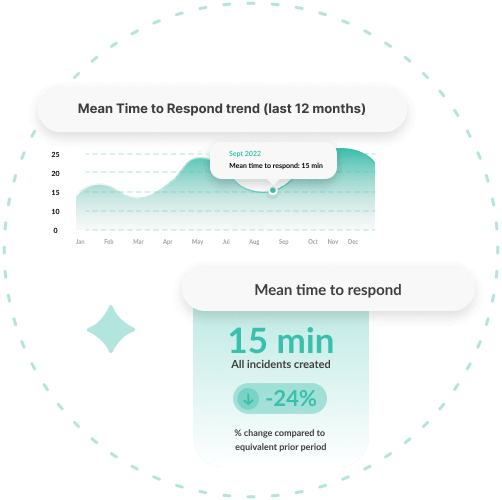
Mean Time to Respond
Perhaps one of the most important metrics in incident management, Mean Time to Respond is useful for detecting patterns that enable you to shorten response time.
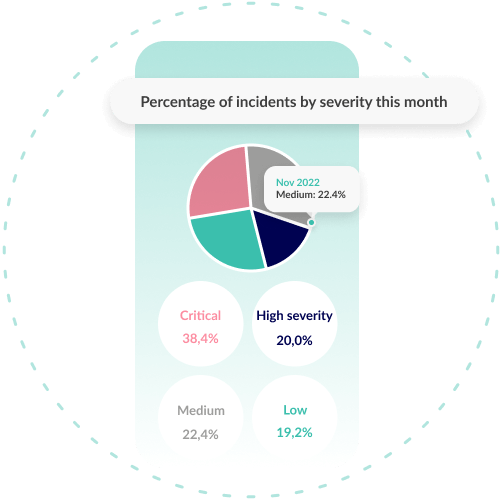
From the Insights section, this is shown by severity level and also expressed as a percentage of change compared to the equivalent prior time period.
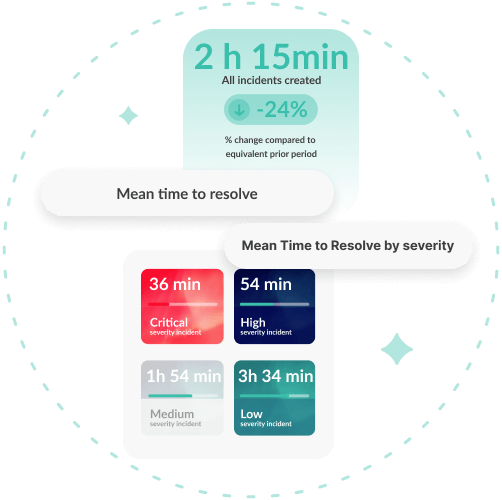
Mean Time to Resolve
The Mean Time to Resolve is the average time to resolve, or conclude an incident. Here you can evaluate the efficiency of your incident management processes which can impact productivity and cost savings.
This section is expressed as a percentage of change compared to the equivalent prior period, also includes the severity level.